25+ Updated Gmail Statistics (And The Metrics You Should Track)
Do you know your Gmail statistics? Here's why a better understanding leads to more efficient professional emails and relationships.
Table of contents
- 25 Gmail stats you probably didn't know about
- Why we use email
- The challenges of not using Gmail statistics
- Top 6 Gmail stats you should measure
- How Gmail statistics let you down
- The alternative to Gmail stats: Drag
- Wrapping up
- Gmail stats FAQ
How have Gmail statistics shaped the workspace? What can the data from the past 20 years show us about the global work trends? Let's find out!
Email has been the primary mode of office communication since its inception. In fact, approximately 58% of users start their day by checking their email. With remote work becoming increasingly common, this trend is expected to grow. Given the importance of email for workplace tasks, let’s look into key Gmail statistics and the metrics worth tracking. Gmail statistics, much like any other office productivity metrics, help us define the kind of work that happens inside and outside our companies. By understanding how people work, you can grasp the changes in your industry, get insights into the future and create better connections.
25 Gmail stats you probably didn't know about
To get better insights into how much of an influence Gmail has on daily tasks at work, let's take a look at the top most important Gmail stats:
- Gmail has 1.8 billion users
- 75% of Gmail users access their inbox through mobile devices
- 55% of email is opened on mobile exclusively
- Gmail's market share is 30.57%
- The app has been downloaded on Google Play over 10 billion times
- An impressive tool for business email: 90% of US-based startups use Gmail
- Around 68% of incoming messages are classified as promotions
- Gmail has about 3% click-through rates, a metric used by marketing campaigns to define link clicks and other sales metrics (social media has a 1.2% CTR)
- Promotional emails, in fact, are read at a 19.2% rate
- Of which 22% are read within the first hour of being sent
- On average, the return on investment (ROI) of email campaigns made through Gmail is 42%
- A/B testing your promotional emails can enhance its success by 28%
- The most common part of an email to undergo A/B testing is the subject line, at around 90%
- Users spend an average of 28 minutes on Gmail every day
- Each visit lasts an average of 12 minutes
- And the average worker gets 121 emails per day
- Gmail is popular among younger professionals: the market share is 61% of users between 18 and 29 year-olds and 54% of 30 to 44 year-olds
- Gmail is available in 105 languages and is used across the globe
- The anti-spam filters are powerful: only about 0,1% of the messages that reach your inbox are spam
- On the flip side, you shouldn't worry about missed connections: only about 0,05% of messages flagged as spam are mistakes
- According to Statista, Gmail owns over 90% of the market share in India, Spain and Brazil
- People tend to split personal and professional email: the average Gmail user has 1.7 accounts
- Need to clean up your Gmail? Most people do! Users have an average of 5700 emails in their inbox
- The account can store approximately 17000 emails
- Migrating from Outlook to Gmail is easy: over 20 billion messages have been moved to Google's email client
- Gmail is 20 years old! The first account went live in April 2004!
- Google Workspace is used by over 9 million paying companies
- 67% of employees use their personal devices for work
Given the role Gmail plays in our professional lives, it's important to notice the trends, both on a global and personal scale. That means that the platform has grown in user quantity, importance, and features that shaped the past two decades of Gmail stats. What does it mean for daily Gmail metrics? Let's look into it!
Why we use email
Email is essential to modern, digital work. It's how we communicate with our team (whether we share the same physical space or work across the globe). It's how we deal with suppliers, contractors, clients, platforms and much more. That means we should pay a lot of attention to the details of our inbox to make it work better. With some of our email use, it's even more important to notice the ROI (return on investment). The rate of success from our efforts, so to speak. Is the time working on email well spent? Are the replies achieving something? To understand that, first, we need to look deeper into why we prefer email in the workplace.
In-office communication
How do you communicate with your team? Usually, with email-based tasks, most of them start as incoming messages from your collaborators. So you’d get an email from your leader or coworker asking for your input. The conversation follows an email thread. If you were to access the Gmail statistics you’d probably notice how there are some people you email most often with. There are subjects that show up a lot within these messages. You'd notice the number of sent replies by each user, etc. With that in mind, you’d have a clearer approach to how your workflow is going. Also, where it faces more obstacles and how often changes are required.
Helpdesk
A helpdesk is a crucial part of any company. It’s how you best offer customer service, by having a good email system. For instance, your clients send you a question about the function of your product. A user is facing a hurdle. You should reply quickly. Your inbox collects all of incoming messages at the same place, so you can browse through all the queries and answer them accordingly. You can sort emails by folders, which also allows you to define reply strategies. Determining which subject line is most concerning or which agents should be responsible for specific replies, for instance.
Sales and marketing
The sales teams are typically dependent on email both internally and externally. They deal with other departments to solve technical questions about the products to sell them. So they need a quick and efficient way to reach collaborators. At the same time, they have to be fast, informative, and clear when responding to potential new buyers. On the flip side, if they’re starting an email campaign to acquire new leads, they need to balance the data and the marketing techniques accordingly. Email is a key part of marketing and sales pipelines and measuring points like customer retention, deals closed and replies by campaign allows managers to allocate resources better.
The challenges of not using Gmail statistics
If we aren’t paying attention to our Gmail analytics or any other Gmail stats, some issues might remain unnoticed. By focusing on relevant data, we avoid concerns with distributing workloads between collaborators and between defined department concerns. But more than that, failure to measure the way we email is failure to notice problems before they arise. And by adding a preventative lens to office communication, we avoid a lack of productivity. Here are some difficulties that might happen if we don’t track analytics.
Accountability x Gmail stats
One of the issues that might happen due to a lack of tracking analytics is an uneven workload. How does a team know how much each collaborator is doing? And their overall productivity, if there isn’t a way to measure it? For example, a manager tries to evenly allocate tasks to their helpdesk employees. They might not notice that some are likely getting harder queries, which take longer to fulfill. In turn, this means longer reply times for these employees, which dissatisfies customers waiting on customer support.
Measuring goals x Gmail stats
Of course, on a preventative basis, it’s important to see how not having Gmail statistics can contribute negatively as well. For instance, say each sales employee has to send a number of campaign contacts each month. Of course, they need to be able to track these messages. Then, mark the successful ones and see which tend to succeed. There isn’t a way to fully understand what does and what doesn’t impact reaching the goals. So, how can employees allocate their resources?
Defining projects x Gmail stats
Try Drag free. Shared inbox + AI inside Gmail
200,000+ teams use Drag to manage shared emails. 7-day trial, no credit card.
Top 6 Gmail stats you should measure
Now we’ve established that understanding your Gmail statistics is important short-term and long term. But how do you decide which information to track? Here are a few of the most relevant data points.
1. Received and sent messages
This allows you to see how many emails your team sends and receives per period. You’d want to know this information to measure the workload a specific department gets. For example, how many helpdesk queries your company gets daily. Or how many replies a sales pitch got. By measuring Gmail statistics, you can categorize incoming mail by days, weeks and months, which allows you to view your peak times as well. So, for instance, if you’re launching a new product, you might expect extra mail.
2. Response time
Response time is one of the top priorities with professional email. There’s a balance between being quick and efficient, but also offering informative replies. But in the fast-paced customer service environment, it isn’t easy to see how we measure up against expectations. By tracking response time, you understand the general trends in how you and your team answer emails and how to do it better.
3. Open rate
This metric is especially relevant to marketing teams. When strategizing about any campaign, it’s important to set goals. And one of the primary goals is actually reaching the audience. A good way to measure it is by tracking how many recipients open your emails. With this in mind, you can see if the emails are reaching your desired audience. If not, it might be a dissonance of contacts and interests and another campaign strategy could work better. Regardless of why, data is essential to marketing and Gmail stats offer a glimpse into the potential clients' behavior.
4. Conversions
Even if email recipients actually open your emails, do they actually follow through? For example, are launching a new product and offering previews to your current customers? How do you know if are they actually interested? If you email them about it, you can track their conversions, aka if they follow the call to action.
5. Frequent subjects
This is a more abstract metric, but it might make your work email more efficient. Do you know what kind of subject always shows up in office emails? It might be a technical glitch with your product, a concern posed by clients, payment issues, anything. It depends on the department and seniority. But if you measure Gmail statistics, you collect data about the most-used keywords. From there, you can understand the most relevant topics and why. So if helpdesk agents are always reaching out with customer concerns on your app, you might have a bug. If your potential buyers email about pricing too much, you might have an issue there. It’s always worth staying on top of any trends to spot changes and investigate what causes them. That way, you can stop issues from becoming permanent.
6. Agent workload
With client-facing work, such as customer support, efficiency is key. However, there’s a risk of misunderstanding the workload distribution. Managers typically allocate tasks according to availability, but this might not be the best scenario. In fact, when you track the agents’ work, you might run into one of these possibilities. First, an agent might be dealing with more complicated queries, which take longer to fulfill. Secondly, some shifts are busier. And companies, especially global ones, need to be available at all times. So the Gmail stats help you understand who is doing which tasks and how regularly, which means you can distribute them due to availability, but also specialization, timezones and seniority.
How Gmail statistics let you down
There's a native way to view your Gmail statistics, but it isn't as complete as you'd like. Instead of showing data based on content, sender, time or any such metric, it's a simple summary of your inbox. To access it, follow these steps:
- Open Google Dashboard
- Log into your Google account
- Scroll down to Recently used Google Services
- Find the Gmail window
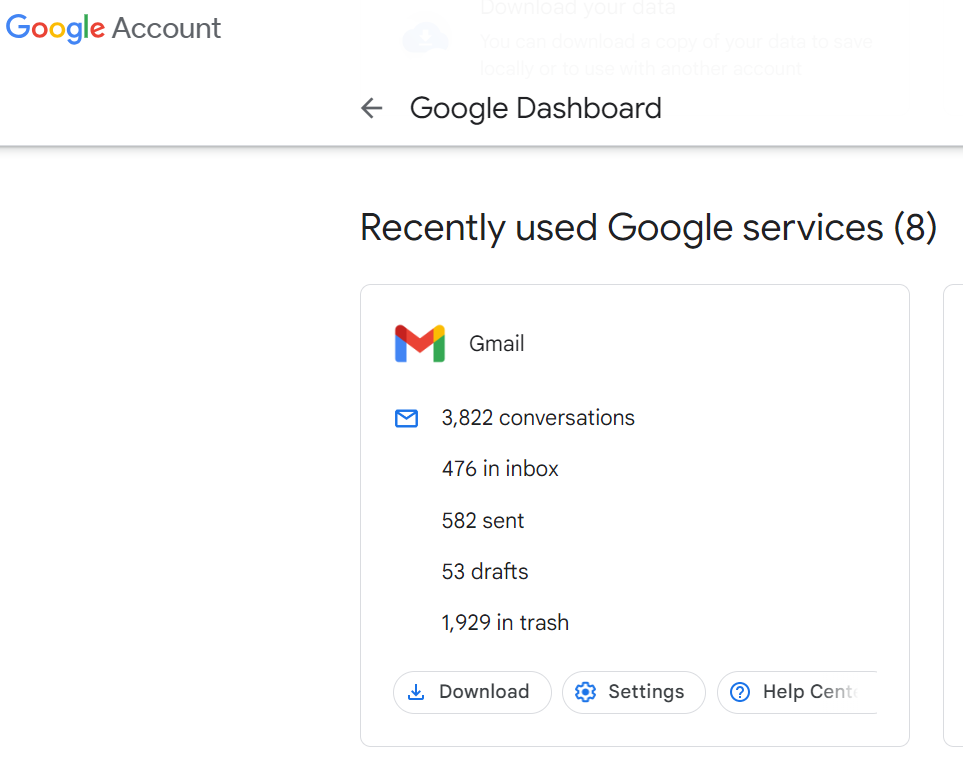 It's a very limited overview, displaying only the amount of open conversations, drafts and trashed messages. While this data can be useful in a way, to determine the state of your inbox and the need to organzie it, it's not very useful to measure productivity.
The alternative to Gmail stats: Drag
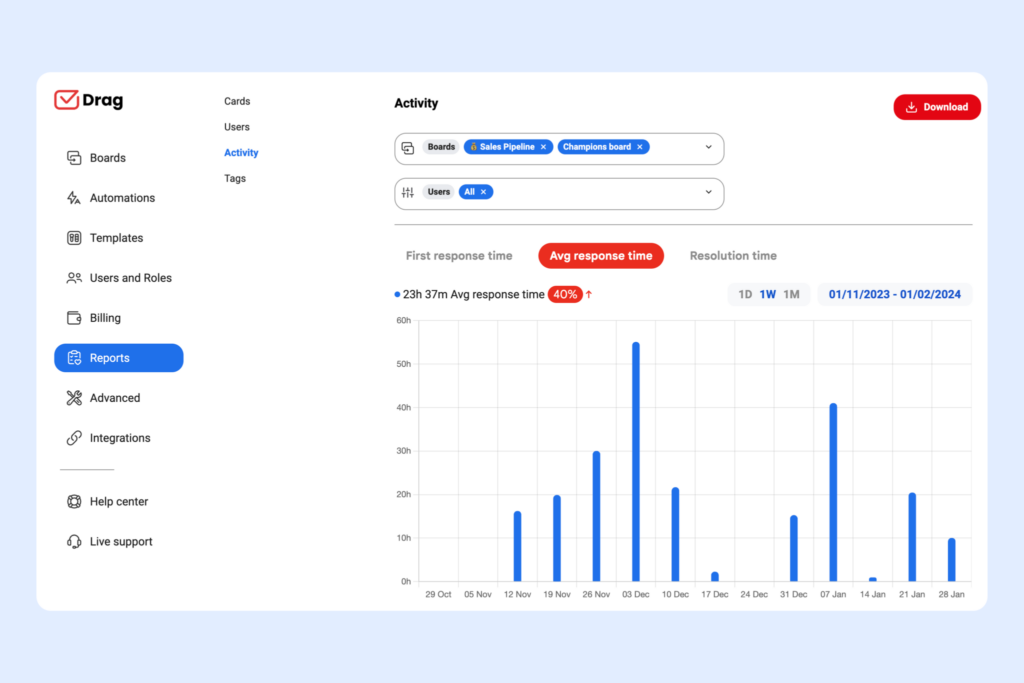
DragApp is a shared inbox for Gmail. As an extension, it transforms your regular inbox into a collaborative space for the helpdesk, sales, task management and other daily tasks. Since the whole team can view everything easily, it cuts down on steps to build better communication. As a free shared inbox, everyone can log in from their own credentials, viewing incoming messages in real-time. With that, it’s much easier to track who is answering to what, which increases accountability. Besides the traditional email view, Drag fulfills the Gmail stats needs with the Kanban boards view. Emails are now task cards. Drag sorts them into boards for the entire team. The cards follow the workflow through the columns and anyone can track the time spent on them, the users involved and any additional information. You can also automate emails into task cards, sorting them into categories for each kind of workflow and department. That way, it’s easy to find what you need and measure the number of tasks to finish at any given time. But the Gmail statistics aren’t just real-time with Drag. Our reports and analytics tool offer insights into the task boards. Then, managers can use them to strategize and come up with solutions for a better workflow.
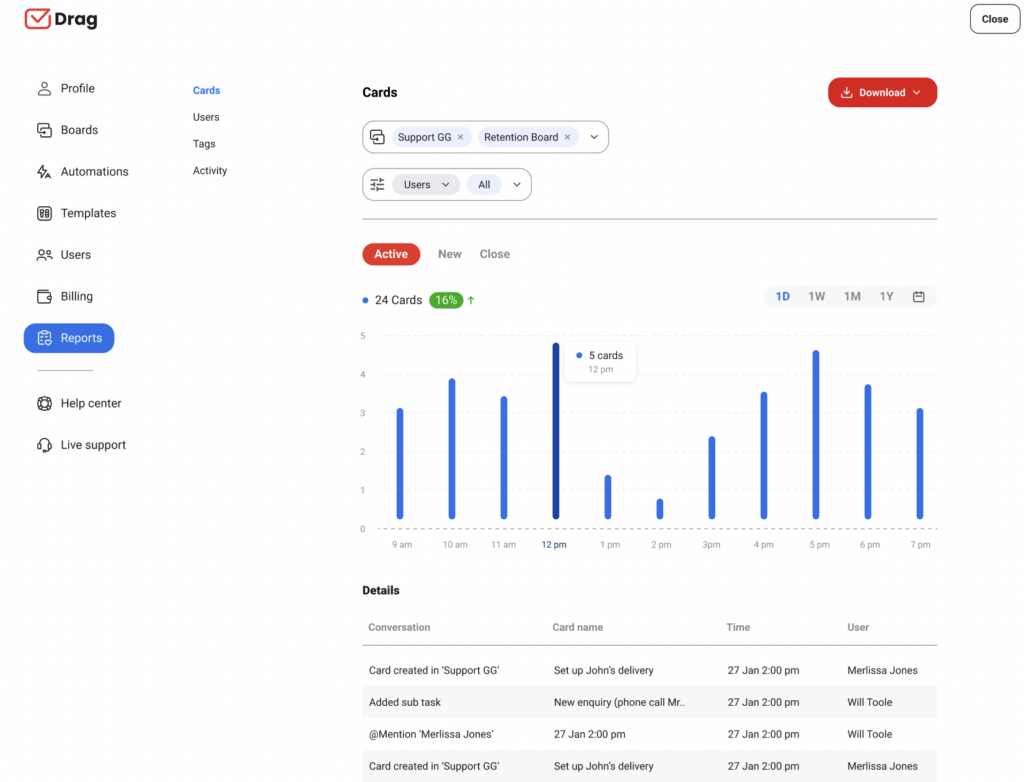 The main advantage of Drag, however, is the option to filter reports by different data points. For example, you can track and monitor ticket resolution rates by user, to see each agent's productivity and barriers. That way, you can use this data to allocate tasks more efficiently to each agent's expertise. You can also monitor by custom shared tags. For example, by adding a tag to one specific product, you can track how long the cards related to it stay in the development stage of your sales team's workflow. Meaning, you can see, with reliable information, how long it takes for each product and service to be sold. This is key for B2B companies, that need to understand their client's demands and offer custom options.
 Wrapping up
Tracking Gmail statistics is an integral part of email usage. While Gmail itself has a limited view of your inbox data, an extension such as Drag allows you to understand your email better and make it work for your needs.
Gmail stats FAQ
- What are Gmail statistics?
Gmail stats are key elemtns of your email use. They include your volume of ingoing and outgoing messages, unread emails, which type of email you receive the most, etc. For a business account, you can consider other statistics as well, such as sales conversion rate via Gmail, new leads acquired and more.
- Which metrics should I track on Gmail?
You shoukd monotor and track data about your daily workflows. For example, when doign customer service on Gmailm you need to track ticket resolution rate, professional email response time and keywords, to check which products or services lead to more issues.
- How can I create Gmail statistics reports?
Nick Timms
Co-founder