












Every AI support agent advertises a resolution rate. This page audits the named claims (Fin's 76%, Sierra's 80%, Decagon's 80%, Ada's 75%) against production evidence, decodes what each vendor counts as resolved, and gives you the test that predicts your own number.
Key takeaways
- Vendors advertise resolution rates of 65 to 86 percent; production evidence clusters at 40 to 70 percent, and Fin's own published case studies sit at 42 to 50 percent. Both sets of numbers are real. The gap is mostly definitions.
- Every headline claim is the vendor's own measurement under the vendor's own definition of resolved, and the definitions move the number by double digits: an assumed resolution can include a customer who simply gave up and left.
- The gap has a price: at $0.99 per outcome, a claimed 76 percent that lands at 45 percent in production nearly doubles your effective cost per genuinely resolved conversation.
- No number on any vendor's page predicts your queue. The only test that does is running an agent against your own historical tickets, measured by your definition of resolved, before any contract conversation.
Table of contents
- The resolution rate claims, audited vendor by vendor
- What counts as "resolved": the four definitions behind every claim
- Real-world AI resolution rates: what production data shows
- What the claims gap costs on per-outcome pricing
- How to test an AI agent's resolution rate on your own tickets
- Where Drag stands on resolution rates
- Frequently asked questions
- Where this fits
The short version: AI support agents advertise resolution rates of 65 to 86 percent, production evidence clusters at 40 to 70 percent, and both numbers are real, because "resolution" means something different on every vendor's pricing page. The most-quoted figures as of August 2026: Fin claims a 76 percent average across 12,000+ customers, Sierra says its agent resolves up to 80 percent of conversations in its Airtable case study, Decagon says it handles 80 percent of Duolingo's tickets with no human involved, and Ada claims 75 percent customer satisfaction with 42 percent faster handling. Every one of those is the vendor's own measurement under the vendor's own definition. This page audits what each claim actually says, shows what production data looks like when someone else measures, and ends with the four-step test that produces the only number that matters: yours.
The resolution rate claims, audited vendor by vendor
Each row is a vendor's own published figure, stated the way the vendor states it, with the definition caveat that changes how you should read it.
| Vendor | Their claim | Who measured it | The caveat that moves the number |
|---|---|---|---|
 Fin Fin | 76% average resolution across 12,000+ customers | Fin, on its own metric | An "outcome" includes assumed resolutions, where the customer exits without asking for more help, which counts customers who gave up |
 Sierra Sierra | Up to 80% of conversations resolved | Sierra's customer page (Airtable case) | "Up to," one flagship customer, definition unpublished |
 Decagon Decagon | 80% of Duolingo's tickets handled with no human | Decagon's homepage | Deflection, not confirmed resolution: the ticket never reached a person, which is not the same as the customer getting an answer that worked |
 Ada Ada | 75% customer satisfaction, 42% faster handling | Ada's homepage | A satisfaction score, not a resolution rate: measures how contained customers felt, not how many issues closed |
Two honest observations about that table. First, none of these companies is lying: each number is presumably true under its own definition, measured on its own customers. Second, the four numbers are not comparable with each other, let alone with your queue, because they measure four different things: an outcome meter, a flagship ceiling, a deflection share, and a satisfaction score. Rankings that line these figures up in one column and crown a winner are comparing apples to weather reports. The two most-compared claims on this table, Decagon's and Sierra's, get the full side-by-side treatment in our Decagon vs Sierra head-to-head.
The rest of the field is its own data point. Parahelp and Lorikeet publish no headline rate at all, eesel offers a simulation on your own tickets instead of a claim, and Salesforce Agentforce publishes no comparable figure. In a category where the loudest numbers come with the loosest definitions, not claiming can be the more honest position.
If you cite these figures elsewhere, cite each as the vendor's own claim with the date, and link this page: claims move, and this audit is updated when they do.
What counts as "resolved": the four definitions behind every claim
The definitions are where the double digits hide. Four terms cover almost every claim you will meet:
- Confirmed resolution. The strictest reading: the customer got an answer and indicated it worked. Almost nobody's headline number uses this one.
- Assumed resolution. The customer exits without asking for more. This puts the customer who got their answer and the customer who gave up in frustration in the same bucket, and it is the definition behind most per-outcome billing.
- Deflection (or containment). The conversation never reached a human, regardless of whether the customer succeeded. A queue can deflect brilliantly while resolving badly.
- Satisfaction. A survey score from whichever conversations got surveyed. Useful, but it is not a resolution rate at all.
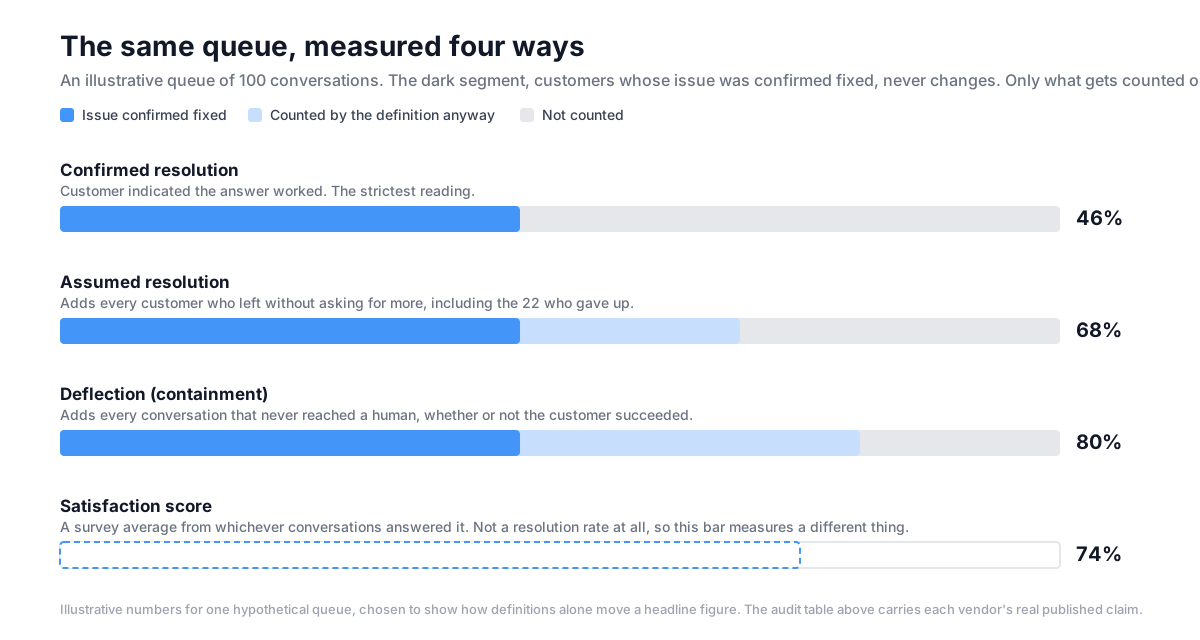
A single support queue, measured all four ways, produces four numbers that can span thirty points. When a vendor's meter charges per outcome, the definition is not a technicality: it is the bill. Our comparison of the four agents covers how each one prices these definitions.
Real-world AI resolution rates: what production data shows
When the measurement moves outside the vendor's marketing, the numbers compress. Published case studies across the category cluster at 40 to 70 percent, driven mostly by ticket mix and knowledge-base quality. Fin's own detailed case studies, the most transparent published body of results in the category, sit at 42 to 50 percent, against its 76 percent headline average.
The most instructive single data point remains Klarna. It claimed its AI was doing the work of 700 agents, then publicly rehired humans after quality dropped: the resolution number went up while the thing it was supposed to measure went down.
None of this means the products fail. It means high-volume, well-documented, repetitive queues at enterprise scale genuinely resolve large fractions, messy or technical or emotionally loaded queues do not, and no vendor's benchmark tells you which one your queue is.
Drag · with Varley
The inbox your team and Varley work in together
Shared inbox and live chat for Gmail teams, with Varley, Drag’s AI, included from $18. Plus an MCP server your own AI tools can drive.
What the claims gap costs on per-outcome pricing
The claims gap becomes a money gap on metered pricing. Worked example, as of August 2026: a team pays Fin $0.99 per outcome and processes 2,000 AI-touched conversations a month. Same tool, same month, same pricing page, at the claimed rate versus a realistic production rate:
| At the claimed 76% | At a production 45% | |
|---|---|---|
| Genuine resolutions | 1,520 | 900 |
| Outcome fees for the month | ~$1,980 | ~$1,980 (assumed resolutions bill too) |
| Cost per genuine resolution | ~$1.30 | ~$2.20 |
| Conversations your team still handled | 480 | 1,100 |
The claimed rate and the production rate produce business cases nearly two-to-one apart, from the same pricing page.
Model your own volume in the [cost calculator](/shared-inbox-cost-calculator/), and the category's wider pricing data lives in our [AI support pricing analysis](/blog/state-of-ai-support-pricing/) and [shared inbox statistics](/blog/shared-inbox-statistics/).How to test an AI agent's resolution rate on your own tickets
The four-step protocol above the fold of this page's data is simple enough to run in a week: define resolved yourself, pull a real month of tickets, run a simulation or pilot on them (eesel's simulation mode is the cheapest honest test in the category, and any serious vendor will negotiate a pilot), and price the result rather than the claim. A vendor that resists being measured by your definition on your tickets is telling you its number.
Where Drag stands on resolution rates
Full disclosure, since this page judges everyone else's claims: Drag's assisted AI does not advertise a resolution rate, because in the assisted model the team resolves conversations with AI drafting, triaging, and summarizing in the seat, and a resolution percentage for the AI alone would be theater. Drag's Intelligence capability, which takes routine conversations through to resolution under named ownership with escalation to a human, is rolling out now, and when it publishes numbers they will come with the definition attached, on this page's standard. Try Drag free for 7 days, no card required, and judge the assisted model on your own queue.
Frequently asked questions
What resolution rate can an AI support agent realistically achieve?
Production evidence clusters at 40 to 70 percent as of August 2026, driven mostly by ticket mix and knowledge-base quality. High-volume, repetitive, well-documented queues land at the top of that range; technical or emotionally loaded queues land lower. Vendor headline claims of 65 to 86 percent measure their own definitions on their own customers.
Do AI agents really resolve 80% of tickets?
Sometimes, under specific definitions: Decagon's 80 percent at Duolingo measures deflection, and Sierra's 80 percent at Airtable is an "up to" flagship case. Fin's own detailed case studies sit at 42 to 50 percent against its 76 percent headline. Plan on 40 to 70 percent for your own queue until you test it.
What is the difference between resolution rate and deflection rate?
Resolution means the customer's issue was actually settled, ideally confirmed by the customer. Deflection means the conversation never reached a human, whether or not the customer succeeded. A high deflection rate with a low resolution rate describes customers being kept away from help, which is why the definition behind any percentage matters more than the percentage.
Why do vendor resolution claims differ from production results?
Three reasons: definitions (assumed resolutions and deflection inflate against confirmed resolution), selection (headline numbers come from flagship customers with ideal ticket mixes), and knowledge quality (benchmark deployments have curated knowledge bases; real ones start messy). The same queue measured four common ways can span thirty points.
How do I test an AI agent before buying?
Define resolved in your own words, export a real month of conversations, then run a simulation on those historical tickets or negotiate a paid pilot on live traffic, measured by your definition. Divide total cost by genuine resolutions to get your true unit price. The full four-step protocol is on this page.
Where this fits
The four-agent comparison puts these vendors side by side on architecture and pricing, the buyer-segmented roundup maps the wider field, and the alternatives pages carry the receipts per vendor: Fin, Sierra, Decagon, and Ada. For what the category costs: shared inbox statistics and the cost calculator. And if the assisted model fits your team better than an autonomous bot, the AI shared inbox guide is the deciding page.

Co-founder
Building Drag for nearly ten years: shared inboxes, boards, and now the AI and agent layer, all on Gmail, plus HeyHelp for the personal inbox. Writes the honest versions of the comparisons.